Key figures |
||||||||||
In millions of euros |
|
2011/12 |
|
2012/13 |
|
2013/14 |
|
2014/15 |
|
2015/16 |
|
|
|
|
|
|
|
|
|
|
|
Revenue |
|
12,058.2 |
|
11,524.4 |
|
11,007.2 |
|
11,189.5 |
|
11,068.7 |
EBITDA |
|
1,301.9 |
|
1,431.3 |
|
1,374.0 |
|
1,530.1 |
|
1,583.4 |
EBITDA margin |
|
10.8% |
|
12.4% |
|
12.4% |
|
13.7% |
|
14.3% |
EBIT |
|
704.2 |
|
843.1 |
|
788.4 |
|
886.2 |
|
888.8 |
EBIT margin |
|
5.8% |
|
7.3% |
|
7.1% |
|
7.9% |
|
8.0% |
Employees (full-time equivalent) |
|
46,473 |
|
46,351 |
|
47,485 |
|
47,418 |
|
48,367 |
Research expenses |
|
117.0 |
|
126.0 |
|
128.0 |
|
127.0 |
|
132.0 |
Operating expenses for environmental protection systems |
|
212.0 |
|
213.0 |
|
218.0 |
|
222.0 |
|
237.0 |
Environmental investments |
|
32.0 |
|
27.0 |
|
23.0 |
|
42.0 |
|
55.0 |
Crude steel production (in millions of tons)** |
|
7.572 |
|
7.529 |
|
8.118 |
|
7.929 |
|
7.733 |
CO2 emissions per ton of crude steel (in tons)*/** |
|
1.67 |
|
1.64 |
|
1.61 |
|
1.60 |
|
1.67 |
|
|
|
|
|
|
|
|
|
|
|
* Figures collected per calendar year |
||||||||||
** All quantities expressed as tons in this Corporate Responsibility Report are metric tons (1,000 kg) |
||||||||||
Revenue by regions
Business year 2015/16

Revenue by divisions
Business year 2015/16

Revenue by industries
Business year 2015/16

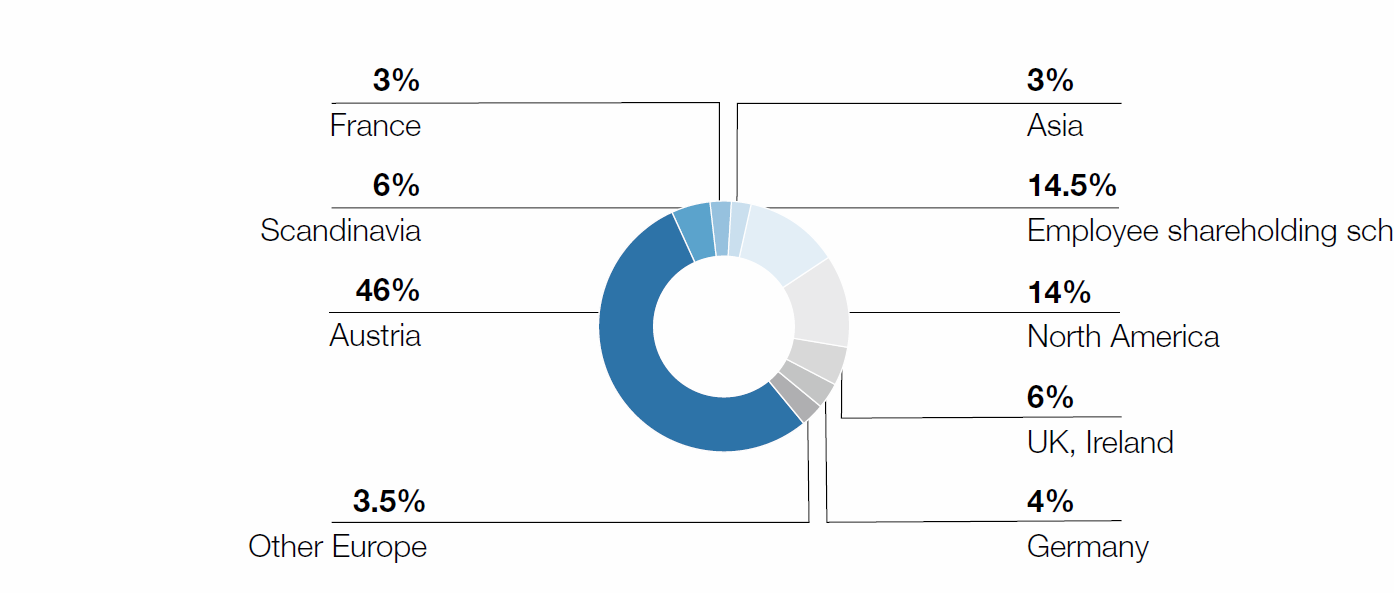
Shareholder structure

Share page