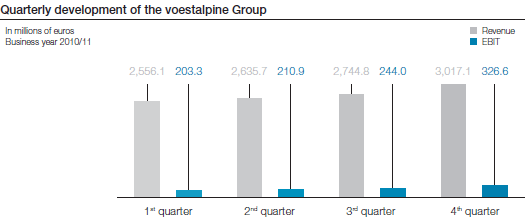
The table below provides an overview of the development of key financial figures over the four quarters of the business year 2010/11:
| (XLS:) Download |
|
Quarterly development of the voestalpine Group |
|
|
|
| ||||||
|
In millions of euros |
|
1st quarter 2010/11 |
|
2nd quarter 2010/11 |
|
3rd quarter 2010/11 |
|
4th quarter 2010/11 |
|
BY |
|
|
|
|
|
|
|
|
|
|
|
|
|
Revenue |
|
2,556.1 |
|
2,635.7 |
|
2,744.8 |
|
3,017.1 |
|
10,953.7 |
|
|
350.9 |
|
359.6 |
|
396.5 |
|
498.6 |
|
1,605.6 | |
|
|
13.7% |
|
13.6% |
|
14.4% |
|
16.5% |
|
14.7% | |
|
|
203.3 |
|
210.9 |
|
244.0 |
|
326.6 |
|
984.8 | |
|
|
8.0% |
|
8.0% |
|
8.9% |
|
10.8% |
|
9.0% | |
|
Profit before tax (EBT) |
|
156.5 |
|
161.0 |
|
197.4 |
|
266.1 |
|
781.0 |
|
Profit for the period |
|
121.1 |
|
128.6 |
|
150.6 |
|
194.3 |
|
594.6 |
|
Employees |
|
39,595 |
|
39,862 |
|
40,078 |
|
40,700 |
|
40,700 |
|
|
|
|
|
|
|
|
|
|
|
|
|
|
|
|
|
|
|
|
|
|
|
|

