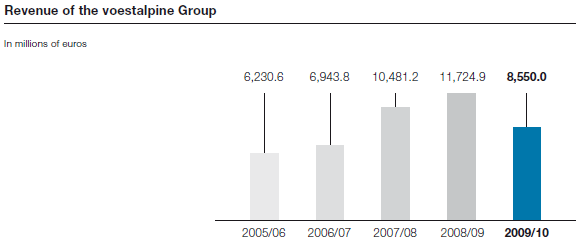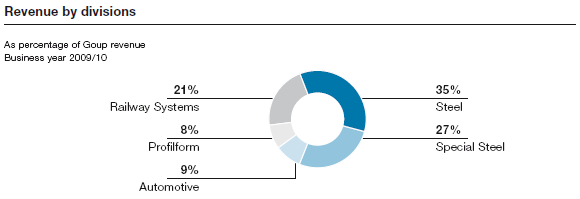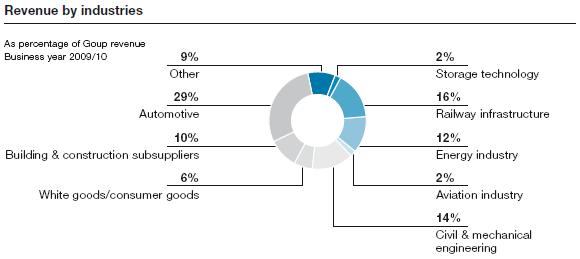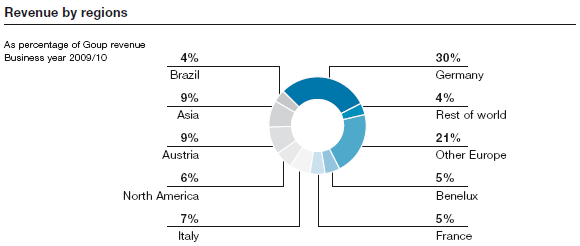
The revenues of the voestalpine Group fell in 2009/10 compared to the business year 2008/09 by EUR 3,174.9 million (–27.1%) from EUR 11,724.9 million to EUR 8,550.0 million. With a decrease of EUR 1,229.8 million (–28.4%), the Steel Division reported the greatest drop in absolute figures, as especially the first half of the year was marked by very weak demand and an extremely low price level compared to the same period of 2008/09 that had seen record figures. In relative terms, the Profilform Division was most strongly affected, with revenues that went down by 36.9% from EUR 1,147.1 million to EUR 724.0 million due to a slump in demand, especially in the construction and construction supply industry as well as in the commercial vehicle sector. In the Special Steel Division, low demand in practically all countries and industries during the first half of 2009/10 and a reduction of inventory levels along the entire value chain that continued until the fall of 2009 resulted in substantial declines in both volumes and earnings so that the division recorded revenues of EUR 2,358.4 million that were 33.2% lower than in the previous year (EUR 3,530.6 million). The Railway Systems Division proved to be more resistant to the crisis with a drop in revenue staying within manageable limits at 18.8%, going from EUR 2,351.0 million to EUR 1,908.5 million. This relative stability was due to the very good market environment in the railway infrastructure segment in the first half of the year, as well as the recovery in the wire and seamless tube segments from the second half of 2009/10 on. The Automotive Division had the smallest drop in sales revenue both in absolute and relative figures, with a reduction by EUR 153.2 million (–15.5%) from EUR 988.6 million to EUR 835.4 million, as direct sales to automobile manufacturers remained almost constant despite the difficult economic environment, thus enabling market share to grow. The lower sales revenue resulted essentially from a decline in deliveries to systems suppliers (Tier 1 customers).

In evaluating the current economic development, a comparison of the quarters with the immediately preceding quarter throughout the year has far more informative value than an overall year-to-year comparison. While a positive trend reversal with regard to results began in the second quarter of 2009/10, the turnaround with regard to revenue—after five consecutive quarters with declining earnings—did not occur until the third quarter of 2009/10. In the fourth quarter of 2009/10, at EUR 2,261.7 million sales increased substantially by 7.4% compared to the quarter immediately preceding it (EUR 2,106.6 million). All divisions contributed to the increase in revenue, with the spectrum of variation ranging from +12.9% (Special Steel Division) to +3.7% (Steel Division).

As far as the individual divisions are concerned, starting in the third quarter of 2009/10, the Steel Division profited primarily from the gradual recovery in the automobile industry, thus enabling full utilization of capacity during the second half of the business year, with the exception of a few limitations due to the (scheduled) major overhaul of one of the two small blast furnaces.
In the Special Steel Division, the increasingly low inventories along the entire value chain, the economic recovery in Asia, and an economic uptrend in South America that was gaining momentum had a positive effect on business performance during the course of the year. As far as individual industries are concerned, the largest growth in demand came from the automobile and consumer goods sectors. From the fall of 2009 on, the Automotive Division profited primarily from the recovery trend in the European midsized, executive, and luxury classes, which had previously not benefited in any significant way from the government-initiated incentive programs as compared to the compact car segment. For the Profilform Division, positive development in the logistics segment, strong growth in the solar energy segment, and toward the end of the business year, a slight rise in demand—albeit starting from a very low level—for commercial vehicles were the reasons for increasing revenues in the year-to-year comparison. In the Railway Systems Division, the marked recovery and increasing capacity utilization in the wire and seamless tube segments during the second half of the year were able to compensate for the competition in the rail and turnout segments that grew in intensity toward the end of the business year.


