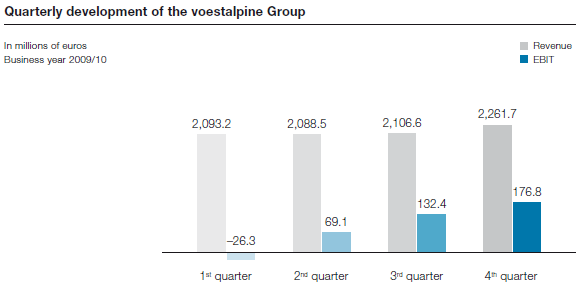
The table below provides an overview of the development of key financial figures over the four quarters of the business year 2009/10:
Quarterly development of the voestalpine Group |
|
|
|
|||||||
|
|
1st quarter 2009/10 |
|
2nd quarter 2009/10 |
|
3rd quarter 2009/10 |
|
4th quarter 2009/10 |
|
BY |
|
|
|
|
|
|
|
|
|
|
|
Revenue |
|
2,093.2 |
|
2,088.5 |
|
2,106.6 |
|
2,261.7 |
|
8,550.0 |
|
134.2 |
|
232.6 |
|
297.1 |
|
340.4 |
|
1,004.3 |
|
|
6.4% |
|
11.1% |
|
14.1% |
|
15.1% |
|
11.7% |
|
|
–26.3 |
|
69.1 |
|
132.4 |
|
176.8 |
|
352.0 |
|
|
–1.3% |
|
3.3% |
|
6.3% |
|
7.8% |
|
4.1% |
|
Profit before tax (EBT) |
|
–70.1 |
|
27.8 |
|
89.8 |
|
135.8 |
|
183.3 |
Profit for the period |
|
–48.2 |
|
28.4 |
|
71.5 |
|
135.1 |
|
186.8 |
Employees (excl. temporary personnel and apprentices) |
|
40,801 |
|
39,919 |
|
39,404 |
|
39,406 |
|
39,406 |
|
|
|
|
|
|
|
|
|
|
|
|
|
|
|
|
|
|
|
In millions of euros |
||


