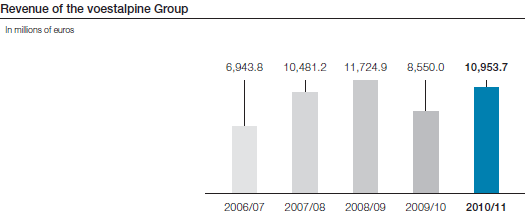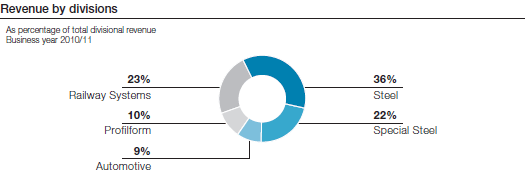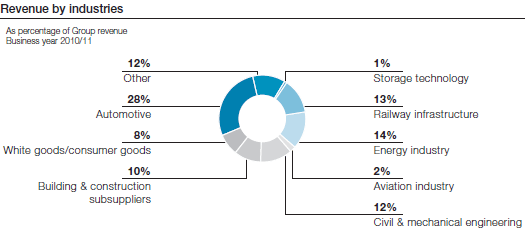
Compared to the same period of the past business year, the voestalpine Group’s revenue increased in the business year 2010/11 by EUR 2,403.7 million or 28.1%, going up from EUR 8,550.0 million to EUR 10,953.7 million, the second-highest figure in the Company’s history after 2008/09 (EUR 11,724.9 million). With a growth of EUR 1,076.3 million (+34.7%) from EUR 3,098.7 million to EUR 4,175.0 million, the Steel Division reported the highest increase in absolute figures and the second-highest increase in relative figures due to both higher volumes and higher prices. The highest relative boost in revenue, with a plus of 38.8%, was reported by the Special Steel Division, which went from EUR 1,895.4 million to EUR 2,631.3 million; however, this division was also impacted most severely by the economic downturn in the previous year. In both steel divisions, the revenue gain is the result of a broadly based rise in demand from almost all important customer industries. Higher supply requirements, primarily from the solar energy, the bus and commercial vehicle industry, and the agricultural machinery sector resulted in an increase of revenue in the Profilform Division of 30.8% from EUR 871.3 million to EUR 1,139.3 million.

Continuing high demand from the emerging countries, especially for vehicles from the premium segment, and an even greater pick-up in demand for commercial vehicles resulted in revenue for the Automotive Division of EUR 1,040.1 million in the business year 2010/11, which was 24.5% higher than the comparative figure in the previous year (EUR 835.4 million). Thus, the division exceeded the revenue benchmark of EUR 1 billion for the first time since its establishment in 2001. Due to its strong resistance to crisis, the Railway Systems Division’s revenue level had remained comparatively stable in the previous year, so that, viewed relatively, its growth of 18.6% from EUR 2,295.8 million to EUR 2,723.3 million was the lowest of all the divisions.

In evaluating the current economic performance, the comparison with the immediately preceding quarter has particularly significant informative value, and, here, the pattern continues to be gratifying. Driven by the positive performance of all the divisions, the voestalpine Group has shown a continuous increase of its revenue since the third quarter of 2009/10; most recently, in the fourth quarter of 2010/11, revenue went up yet again by 9.9% compared to the immediately preceding quarter, going from EUR 2,744.8 million to EUR 3,017.1 million.
Despite the fact that the Group’s production capacity is being fully utilized, in the business year 2011/12, there will be an opportunity for additional growth not only with regard to prices, but also to volumes, since the Steel Division will be increasing its capacity in the fall of 2011 along the entire value chain by about 10%, and the Special Steel Division should also be able to increase volumes to a certain degree by eliminating bottlenecks.

