Liquidity risk refers to the risk of not being able to fulfill the payment commitments due to insufficient means of payment.
The primary instrument for controlling liquidity risk is a precise financial plan that is submitted quarterly by the operating entities directly to the Group treasury of voestalpine AG. The funding requirements in respect of financing and bank credit lines are determined by the consolidated results.
Working capital is financed by the Group treasury. A central clearing system performs intra-group netting daily. Entities with liquidity surpluses indirectly put these funds at the disposal of entities requiring liquidity. The Group treasury places any residual liquidity with their principal banks. This allows the volume of outside borrowing to be decreased and net interest income to be optimized.
Financing is mostly carried out in the local currency of the borrower in order to avoid exchange rate risk or is currency-hedged using cross-currency swaps.
voestalpine AG holds securities and current investments as a liquidity reserve. As of March 31, 2011, non-restricted securities amounted to EUR 318.9 million (March 31, 2010: EUR 394.6 million) and current investments to EUR 1,233.4 million (March 31, 2010: EUR 1,028.6 million).
Additionally, adequate credit lines that are callable at any time exist with domestic and foreign banks. These credit lines have not been drawn. In addition to the possibility of exhausting these financing arrangements, a contractually guaranteed liquidity reserve of EUR 150 million is available to bridge any economic downturns.
The sources of financing are managed on the basis of the principle of bank independence. Financing is currently being provided by approximately 25 different domestic and foreign banks. Covenants agreed for a minor part of the total credit volume with a single bank are adhered to. The capital market is also used as a source of financing. In the business year 2010/11, a senior bond with a volume of EUR 500.0 million and a term of seven years was issued.
A maturity analysis of all liabilities existing as of the reporting date is presented below:
| (XLS:) Download |
|
Liabilities |
|
|
|
|
|
|
|
|
|
|
|
|
|
|
|
Due within |
|
Due between one and five years |
|
Due after more than five years | ||||||
|
|
|
2009/10 |
|
2010/11 |
|
2009/10 |
|
2010/11 |
|
2009/10 |
|
2010/11 |
|
|
|
|
|
|
|
|
|
|
|
|
|
|
|
Bonds |
|
222.0 |
|
111.0 |
|
510.5 |
|
399.7 |
|
0.0 |
|
496.0 |
|
Bank loans |
|
1,171.2 |
|
1,252.1 |
|
2,676.0 |
|
2,109.3 |
|
24.8 |
|
13.4 |
|
Trade payables |
|
898.3 |
|
1,113.1 |
|
0.4 |
|
0.0 |
|
0.0 |
|
0.0 |
|
Liabilities |
|
6.0 |
|
5.1 |
|
25.0 |
|
25.8 |
|
31.3 |
|
26.0 |
|
Other financial liabilities |
|
9.5 |
|
16.4 |
|
0.6 |
|
0.3 |
|
0.0 |
|
0.0 |
|
Total liabilities |
|
2,307.0 |
|
2,497.7 |
|
3,212.5 |
|
2,535.1 |
|
56.1 |
|
535.4 |
|
|
|
|
|
|
|
|
|
|
|
|
|
|
|
|
|
|
|
|
|
|
|
|
|
In millions of euros | ||
As estimated as of the reporting date, the following prospective interest charges correspond to these existing liabilities:
| (XLS:) Download |
|
|
|
Due within |
|
Due between one and five years |
|
Due after more than five years | ||||||
|
|
|
2009/10 |
|
2010/11 |
|
2009/10 |
|
2010/11 |
|
2009/10 |
|
2010/11 |
|
|
|
|
|
|
|
|
|
|
|
|
|
|
|
Interest on bonds |
|
54.1 |
|
65.3 |
|
76.4 |
|
130.1 |
|
0.0 |
|
47.6 |
|
Interest on bank loans |
|
113.6 |
|
114.4 |
|
232.3 |
|
181.9 |
|
2.5 |
|
3.9 |
|
Interest on |
|
0.0 |
|
0.0 |
|
0.0 |
|
0.0 |
|
0.0 |
|
0.0 |
|
Interest on liabilities |
|
2.6 |
|
2.4 |
|
8.7 |
|
8.3 |
|
7.0 |
|
4.5 |
|
Interest on other |
|
0.0 |
|
0.0 |
|
0.0 |
|
0.0 |
|
0.0 |
|
0.0 |
|
Total interest charges |
|
170.3 |
|
182.1 |
|
317.4 |
|
320.3 |
|
9.5 |
|
56.0 |
|
|
|
|
|
|
|
|
|
|
|
|
|
|
|
|
|
|
|
|
|
|
|
|
|
In millions of euros | ||
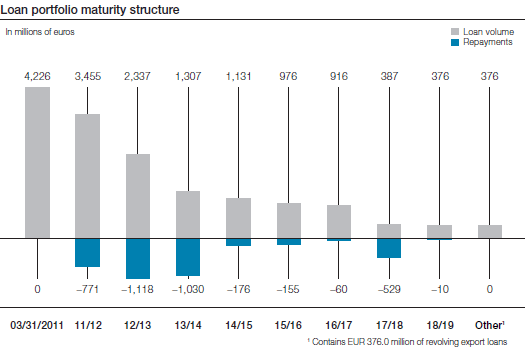
The maturity structure of the loan portfolio has the following repayment profile for the next several years.

