| (XLS:) Download |
|
voestalpine Group |
|
|
|
|
|
|
|
In millions of euros |
|
2010/11 |
|
2011/12 |
|
Change in % |
|
|
|
|
|
|
|
|
|
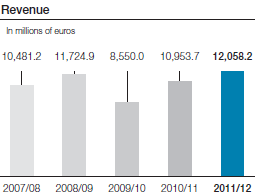
Revenue |
|
10,953.7 |
|
12,058.2 |
|
10.1 |
|
|
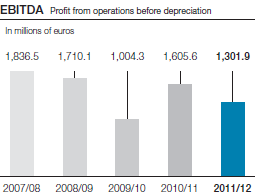
1,605.6 |
|
1,301.9 |
|
–18.9 | |
|
|
14.7% |
|
10.8% |
|
| |
|
|
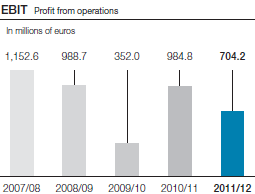
984.8 |
|
704.2 |
|
–28.5 | |
|
|
9.0% |
|
5.8% |
|
| |
|
Employees (full-time equivalent) |
|
45,260 |
|
46,473 |
|
2.7 |
| (XLS:) Download |
|
voestalpine Divisions |
|
|
|
|
|
|
|
|
|
|
|
In millions of euros |
|
Steel |
|
Special Steel |
|
Metal |
|
Profilform |
|
Automotive |
|
|
|
|
|
|
|
|
|
|
|
|
|
Revenue |
|
4,130.3 |
|
2,945.0 |
|
2,955.6 |
|
1,251.5 |
|
1,224.6 |
|
EBIT |
|
226.5 |
|
272.9 |
|
96.9 |
|
126.6 |
|
58.5 |
|
EBIT margin |
|
5.5% |
|
9.3% |
|
3.3% |
|
10.1% |
|
4.8% |
|
Employees |
|
10,702 |
|
12,363 |
|
11,344 |
|
4,556 |
|
6,808 |
  |
  |

